


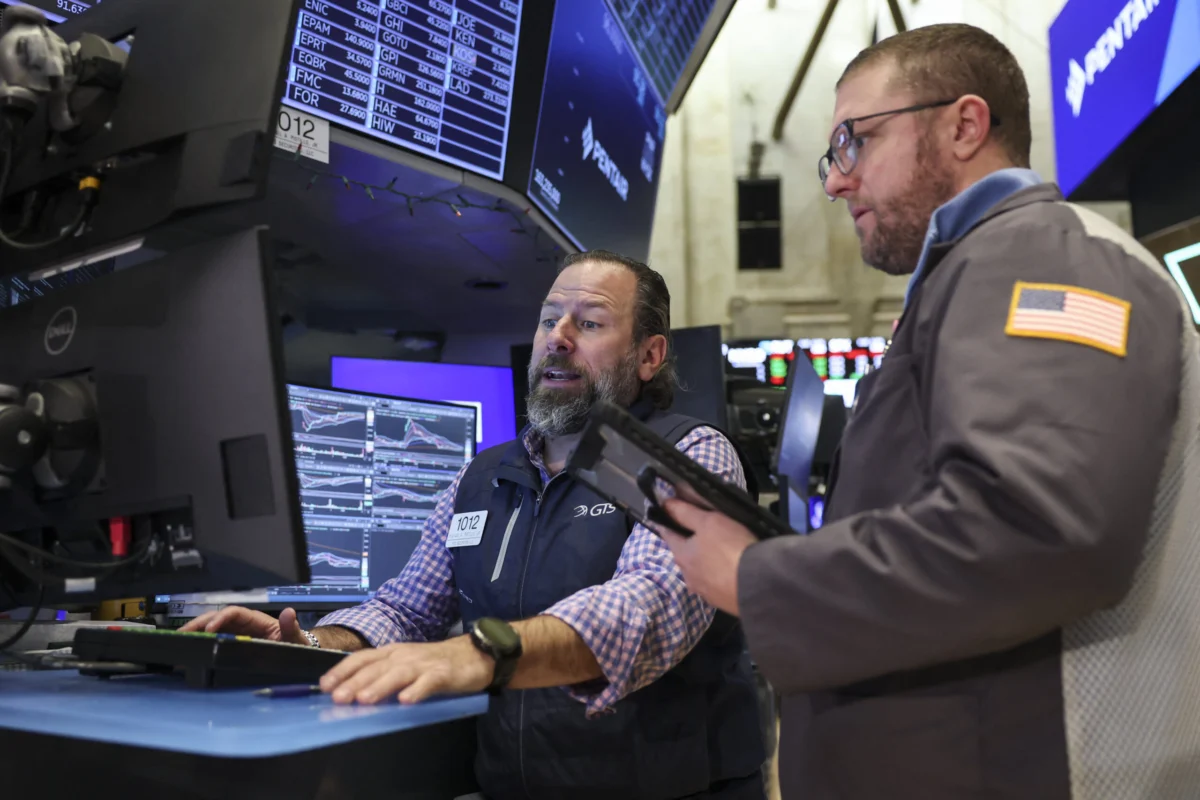
The psychological threshold of a four-digit decline in the Dow Jones Industrial Average (DJIA) has long served as a jarring signal of volatility for global investors, and the recent 1,000-point plummet on a Wednesday in late July 2026 is no exception. This latest contraction, triggered by a complex interplay of stubborn inflationary pressures and escalating geopolitical tensions in the Middle East, marks the ninth time in five years that the blue-chip index has suffered a single-session loss of such magnitude. As the dust settles on the New York Stock Exchange floor, market analysts and institutional investors are turning to historical data to discern whether this sell-off is a harbinger of a prolonged downturn or merely a volatile reset within an enduring bull cycle.
The catalyst for the most recent rout was a dual-pronged shock to investor confidence. First, the Federal Reserve’s Federal Open Market Committee (FOMC) opted to maintain the benchmark interest rate within the 3.5% to 3.75% range. While a pause is often viewed as a neutral signal, the underlying internal dynamics of the meeting revealed a growing hawkishness; three committee members dissented, signaling a preference for an immediate rate hike to combat inflation that remains stubbornly above the central bank’s 2% target. This internal fracture within the Fed suggests that the "higher-for-longer" narrative is not only persisting but potentially intensifying.
Compounding the anxiety over monetary policy is the volatile energy sector. U.S. crude oil prices surged toward the $85 per barrel mark following aggressive rhetoric from the Trump administration regarding potential retaliatory strikes against Iran. The prospect of military friction in the Strait of Hormuz, a critical artery for global energy supplies, has introduced a significant "geopolitical risk premium" into the markets. For the Dow, an index price-weighted and heavily influenced by industrial and energy giants, the combination of rising input costs and the threat of further interest rate hikes created a perfect storm for a 1,000-point retreat.
Historically, the immediate aftermath of a 1,000-point drop follows a remarkably consistent, if somewhat counterintuitive, pattern. Statistical analysis of the nine instances occurring over the last five years reveals that the "day-after" performance is typically flat on a median basis, as the market undergoes a period of price discovery and digestion. However, the one-week outlook is generally more somber. On a median basis, the Dow tends to lose an additional 1.14% in the five trading days following a massive sell-off. This suggests that initial "dip-buying" is often overwhelmed by secondary waves of institutional de-risking and algorithmic selling triggered by technical breaches.
Yet, for the patient investor, these moments of high-velocity selling have historically served as entry points rather than exits. Data indicates that one month after a 1,000-point decline, the Dow sees a median recovery of nearly 2%. Looking further out to the three-month horizon, the gains become even more substantial, with a median bounce of 9.1%. This "V-shaped" or "U-shaped" recovery pattern highlights the resilience of large-cap American equities and the tendency for markets to overreact to short-term shocks before mean-reverting toward long-term earnings growth.
To understand the current market temperament, one must look back at the preceding eight episodes of extreme volatility that have defined the 2020s. A significant cluster of these declines occurred in April 2025, during the fallout of the "Liberation Day" policy announcement. The administration’s move to implement sweeping reciprocal tariffs across the globe sent shockwaves through international trade corridors. Three of the nine major drops in the last five years occurred during this period as investors grappled with the implications of a renewed global trade war. The Dow only found its footing after a 90-day pause on the tariff plan was announced, though the recovery remained fragile as high-level tensions with China persisted.
Before the trade-induced volatility of 2025, the market was defined by the aggressive tightening cycle of 2022. That year saw four separate 1,000-point declines as the Federal Reserve engaged in a historic battle against surging post-pandemic inflation. In 2022, the primary fear was that the Fed’s rapid rate hikes would "break" the economy, leading to a hard landing. The major averages indeed slumped into bear market territory, but as is often the case with such dramatic resets, the bottom was reached in October 2022, paving the way for the current bull market. The lesson from 2022 was clear: while the Fed can initiate a sell-off through policy tightening, the market eventually adapts to the new cost of capital.
The remaining two major declines occurred in 2024, each driven by distinct macroeconomic anxieties. In August 2024, a weaker-than-anticipated U.S. labor market report coincided with a sharp "flash crash" in the Japanese equity markets, fueled by the unwinding of the yen carry trade. This event demonstrated the interconnectedness of global liquidity; a shift in Japanese monetary policy could trigger a 1,000-point slide on Wall Street within hours. Later, in December 2024, the Fed again took center stage, signaling a cautious approach to rate cuts that disappointed investors who had priced in a more aggressive easing cycle.
The common thread across all these events is the struggle between growth expectations and the reality of a restrictive monetary environment. In the current 2026 context, the market is facing an "inflationary inertia" that refuses to dissipate despite years of elevated rates. When the Dow drops 1,000 points, it is often a reflection of the market "repricing" the future. If investors believe that the Fed is losing its grip on inflation, or that geopolitical conflict will permanently raise the floor for energy prices, the valuation models for every company in the index must be adjusted downward.
Furthermore, the rise of passive investing and high-frequency trading (HFT) has amplified the velocity of these moves. In the modern era, a 1,000-point move—while still significant—represents a smaller percentage of the total index value than it did in decades past. When the Dow was at 10,000, a 1,000-point move was a 10% catastrophe; at current levels, it represents a more manageable, albeit painful, 2.5% to 3% decline. Nevertheless, the psychological impact remains outsized, often triggering "margin calls" and forced liquidations that accelerate the downward momentum.
Economists are also closely monitoring the "wealth effect" associated with these sharp declines. The Dow Jones Industrial Average remains the most cited barometer of economic health for the American public. A series of 1,000-point drops can dampen consumer confidence, leading to a reduction in discretionary spending, which in turn impacts the very corporate earnings that support stock prices. However, the historical 9.1% three-month recovery suggests that these episodes of "panic" are frequently disconnected from the underlying health of corporate balance sheets. Most components of the Dow—ranging from aerospace leaders to healthcare giants—possess the pricing power necessary to navigate inflationary periods.
As the market moves forward from this latest July 2026 rout, the focus remains squarely on the Federal Reserve’s next move in September. The three dissenting votes in favor of a rate hike have created a "hawkish overhang" that may limit the Dow’s ability to stage a rapid recovery in the immediate week ahead. Simultaneously, the energy market will continue to act as a wildcard. If the situation in the Middle East stabilizes, a rapid retreat in oil prices could provide the necessary catalyst for the median 2% one-month gain that history suggests is coming.
In conclusion, while a 1,000-point drop in the Dow Jones Industrial Average is a visceral reminder of market fragility, it is rarely a terminal event for a bull market. The historical precedent established over the last five years indicates a cycle of shock, followed by a brief period of continued weakness, and ultimately a robust recovery as the market absorbs new economic realities. For the global financial community, the current volatility is not just a moment of loss, but a critical data point in the ongoing narrative of a global economy attempting to find its equilibrium in an era of geopolitical shifts and persistent monetary challenges. History suggests that while the coming week may be difficult, the medium-term outlook for the blue-chip average remains structurally sound.