


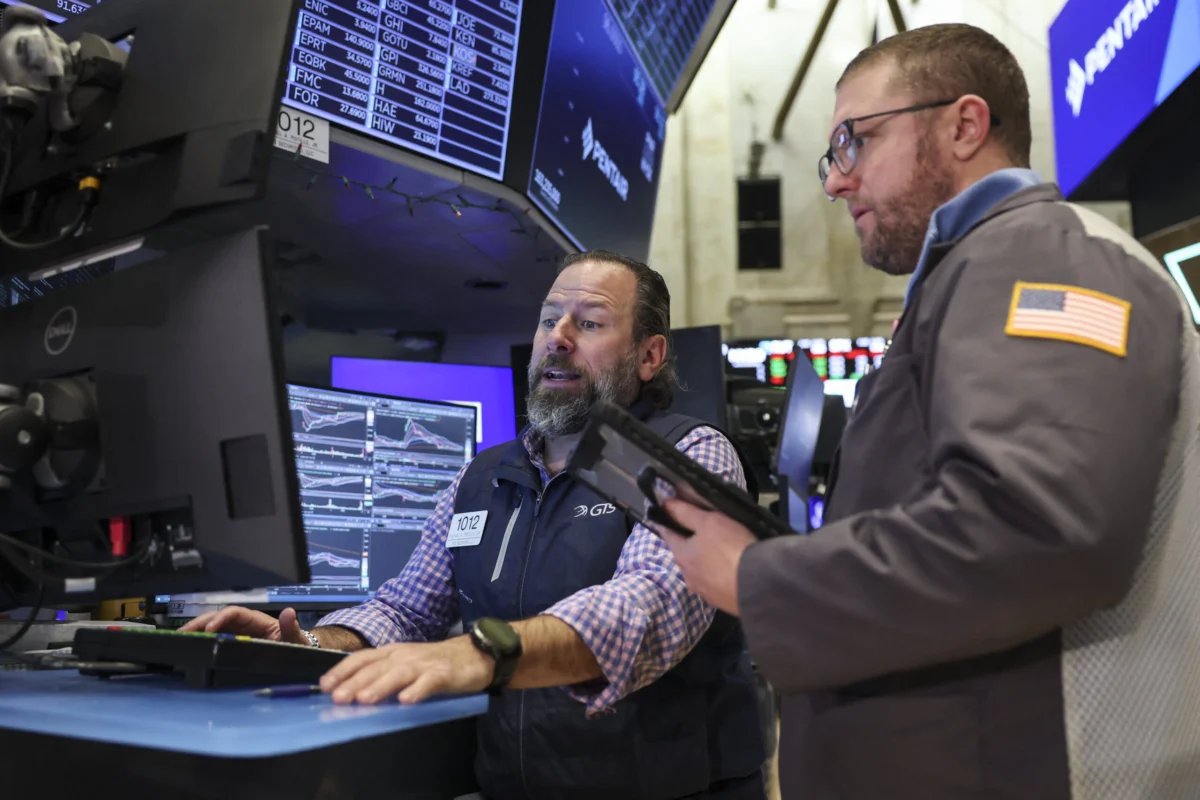
The psychological and financial weight of a four-digit decline in the Dow Jones Industrial Average remains one of the most potent signals of market distress in the modern era. On Wednesday, this threshold was crossed yet again as the blue-chip index plummeted more than 1,000 points, triggered by a complex intersection of hawkish monetary policy signals and escalating geopolitical tensions in the Middle East. As the dust settles on the New York Stock Exchange, investors are left to grapple with a familiar question: is this the beginning of a prolonged retreat or a volatile precursor to a robust recovery?
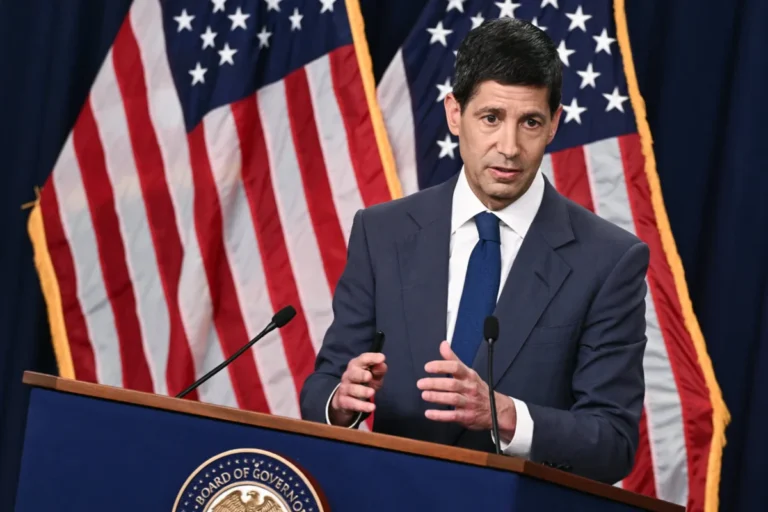
The immediate catalyst for the sell-off was twofold. First, the Federal Reserve opted to maintain the federal funds rate within the 3.5% to 3.75% range. While the "hold" was widely expected, the internal mechanics of the decision revealed a growing schism within the Federal Open Market Committee (FOMC). Three members notably dissented, advocating for an immediate rate hike to combat persistent, above-target inflation. This internal hawkishness caught many market participants off guard, fueling fears that the "higher-for-longer" era is not only staying but could potentially intensify.
Compounding the anxiety from Washington was the volatile situation in the energy markets. U.S. crude oil prices surged toward the $85-per-barrel mark following a sharp escalation in rhetoric from the White House. President Trump’s pledge to retaliate against Iran following an attack on American forces has reignited fears of a supply disruption in the Strait of Hormuz, a critical artery for global energy transit. For a market already sensitive to inflationary pressures, the prospect of an energy-led price spiral acted as the final nudge over the cliff.
To understand the current predicament, one must look at the historical frequency and aftermath of such dramatic declines. Over the past five years, the Dow Jones Industrial Average has closed down by 1,000 points or more on nine separate occasions. While these events often trigger a "state of emergency" sentiment in financial media, empirical data suggests a remarkably consistent pattern of short-term pain followed by medium-term gain.
Statistically, the day following a 1,000-point drop is often characterized by a "wait-and-see" approach, with the index typically remaining flat on a median basis. However, the "aftershock" period usually manifests within the first week. Historical data indicates that one week after such a decline, the Dow tends to lose an additional 1.14% as momentum-based selling and margin calls take their toll.
The narrative shifts dramatically, however, when the horizon is extended. One month after a 1,000-point plunge, the Dow has historically posted a median gain of nearly 2%. Looking out three months, the recovery is even more pronounced, with a median bounce of 9.1%. This suggests that while 1,000-point drops are effective at flushing out "weak hands," they often serve as an attractive entry point for institutional buyers and value investors looking for a "discount" on blue-chip components.
The recent history of these volatility spikes provides a roadmap for the current crisis. Three of the nine major drops occurred during the tumultuous "Liberation Day" period in April 2025. At that time, the Trump administration’s announcement of sweeping reciprocal tariffs sent shockwaves through global supply chains. The Dow suffered a dramatic two-day fall as investors priced in the cost of a global trade war.
Yet, even in that period of high uncertainty, the market’s resilience was on display. Once a 90-day pause on the tariff plan was announced, the Dow rebounded aggressively. Even when specific tensions with China caused secondary dips, the eventual signaling of trade de-escalation by late April 2025 provided the foundation for a significant rally. This underscores a critical market truth: policy-driven volatility is often temporary, provided that a path toward resolution or compromise remains visible.

The year 2022 offered a different set of lessons. That year saw four separate 1,000-point declines, largely driven by the most aggressive Federal Reserve tightening cycle in decades. As inflation reached 40-year highs, the central bank’s decision to hike rates multiple times led to a pervasive fear of an impending recession. The major averages tumbled into bear market territory, and the Dow was not spared.
The 2022 experience is particularly relevant today because it highlights the "bottoming process." Markets eventually bottomed in October 2022, giving birth to the current bull market. The lesson for today’s investors is that while Fed-induced anxiety can cause sharp, painful corrections, the market eventually finds its footing once it "prices in" the terminal rate—the point where the Fed is expected to stop hiking. With three dissenters now calling for hikes, the market is currently in the process of re-calculating that terminal rate.
In 2024, the sources of volatility were more varied. In August of that year, a 1,000-point drop was sparked by a "perfect storm" of a weak U.S. jobs report and the sudden unwinding of the Japanese yen "carry trade." The carry trade—a strategy where investors borrow money in a low-interest-rate currency like the yen to invest in higher-yielding assets elsewhere—collapsed when the Bank of Japan unexpectedly tightened policy. This forced a global liquidation of assets, proving that the Dow is no longer just a reflection of U.S. domestic health but a node in a deeply interconnected global liquidity web.
Later, in December 2024, the Dow fell again as the Federal Reserve signaled a "cautious" approach to rate cuts. At that time, investors had grown overly optimistic about a pivot to lower rates. When the Fed threw cold water on those expectations, the market underwent a sharp repricing. This mirrors the current situation, where the gap between market expectations and central bank reality has once again widened, leading to a violent correction.
The broader economic impact of these 1,000-point swings extends beyond the brokerage accounts of Wall Street. For the average consumer, a massive drop in the Dow can have a "reverse wealth effect." When portfolios shrink, consumer confidence often follows, leading to a reduction in discretionary spending. Furthermore, if the volatility is accompanied by rising oil prices—as it is now—the double whammy of a falling stock market and rising costs at the pump can significantly slow GDP growth.
However, many economists argue that the 1,000-point threshold is not what it used to be. When the Dow was trading at 10,000, a 1,000-point drop was a catastrophic 10% decline. With the Dow at its current elevated levels, a 1,000-point move represents a much smaller percentage change. While the headline number remains a powerful tool for capturing public attention, professional analysts are more focused on the percentage of the move and the volume behind the selling.
The current dissent within the Federal Reserve is perhaps the most significant variable for the coming months. A "hawkish pause"—where the bank holds rates steady but signals future hikes—is notoriously difficult for markets to digest. It creates a "limbo" state where the cost of capital remains high, and the threat of even higher costs looms. If the three dissenters gain more allies in the next meeting, the 1,000-point drop of this Wednesday might be viewed in hindsight as the first warning shot of a new tightening phase.
Conversely, if geopolitical tensions in the Middle East subside and oil prices retreat, the Dow could follow its historical "three-month recovery" script. The resilience of corporate earnings remains a primary pillar of support. Many of the blue-chip companies within the Dow 30 have robust balance sheets and the pricing power necessary to navigate inflationary environments.
As investors look toward the remainder of the quarter, the focus will shift from the shock of the 1,000-point drop to the underlying fundamentals of the U.S. economy. Labor market data, upcoming inflation prints, and the rhetoric from the "dissenting three" at the Fed will be the primary drivers of price action. History suggests that while the immediate aftermath of a thousand-point plunge is often characterized by lingering weakness, the long-term trajectory of the Dow has a stubborn habit of trending upward. The challenge for market participants is to look past the headline-grabbing volatility and recognize the cyclical patterns that have defined the last five years of American equity markets.